Monday, October 21, 2024

But do they superconduct?


Fourth in a series; first is here.

[Epistemic status: speculative. This is more an exploration than an explanation. I am basically trying to get my thoughts together on the subject. Any comments would be quite valuable!]

So the question is, do condensed plasmoids actually condense in the sense of a superconductor? Also, why does it matter? The conductivity of a plasma is generally cited as about that of copper, anyway. The runaway pinch effect is well noted under the name of "sausage instability," and is also noted for causing floods of neutrons if there is deuterium in the plasma mixture. Note that the referenced paper (from 1960!) goes on to say, "Subsequent to the blowup of the instability, the plasma-field configuration is such that the accelerated deuterons can continue to circulate in stable orbits until lost by neutron-producing collisions or by diffusion out of the ends of the geometry."

In more recent times, there has been a lot of work on fusion in plasmas, and specifically using ζ-pinch effects in various geometries. There have been numerous, in-depth studies, e.g. here and here, simulating the electromagnetodynamics of them. That being the case, why haven't plasmoids been more generally predicted, recognized, and experimented with?

One obvious explanation is that no one is looking for them. Existing theories of superconductivity, such as BCS, do not predict that it can happen in plasmas. Plasmas are hot and superconductors are cold. The dynamics of a superconductor are that electrons, which are fermions (which must occupy different states), can pair off into coordinated states that allow a pair of them, called a Cooper pair, to act enough like bosons, which can occupy the same state and thus "condense" into a collective entity which has drastically different properties from the electrons acting individually. But in standard theory, Cooper pairs rely on an attractive force that arises from phonons in the solid crystal structure of the superconductor. (Popular explanations of this are at best misleading, showing electrons as localized points which cause an attractive bunching in the lattice, which then attracts the other electron. But in actuality the electrons are delocalized and are required to have equal and opposite momenta, acting in concert (see above).)

The ζ-pinch itself is nothing more than an attractive magnetic force between (moving) electrons. Although it is beyond my level to sit down and write up a Schrödinger (or Dirac?) equation and Hamiltonian that would be the equivalent to a Cooper pair, it seems like something that might be worth looking into. The result would not be a classic BCS superconductor: it's too hot, not in a solid lattice, depends on rather than excluding magnetic fields, depends on rather than breaking down with large currents, etc ad nauseum. But who knows?

Those are the main reasons not to expect condensed plasmoids to superconduct. The reasons to expect that they might are:

  • Persistence. If a CP is in fact a microscopic current loop carrying kiloamps, it should have a high resistance (due to conducting channel width) even at the resistivity of copper, and a huge I^2R energy dissipation if R is anything other than 0. But they can last for hours.
  • Quiescence. CPs can "go dark" and hide in cracks, crystal boundaries, and microscopic craters without emiting any energy, only to break up with a bang when conditions change.
  • Downconversion of fusion energies. Dicke proposed the name "superradiance" for one-to-many quantum energy transfer 7 decades ago. It has recently been demonstrated, and there are no better theories I am aware of to explain the absence of high-energy nuclear reaction products in experiments. This phenomenon explicitly depends on coherence. See this talk for the latest.

To expand on the last point above, the idea is that in a quantum mechanically described interaction, it is possible to move a dollop of energy, even a large dollop, from one configuration of quantum states to another if various other things are right. Highly oversimplified, if you are fusing deuterium, each fusion gives you a helium nucleus and 24 MeV, which is way way too much to lodge in any individual particle. But if you have a coherent current of 24 million electrons which is a single coherent quantum object, you're only trying to bump each electron up by 1 eV, which doesn't seem like all that much! 

Monday, October 14, 2024

... and cold fusion

  1. Lightning melts Metals; and I hinted in my Paper on that Subject, that I suspected it to be a cold Fusion (I do not mean a Fusion by Force of Cold, but a Fusion without Heat.)
-- Benjamin Franklin, second letter to Peter Collison dated July 29, 1750

[This is the third post in a series; the first is here.]

The man who coined the phrase "cold fusion" was none other than Benjamin Franklin, in connection with his experiments on electricity and lightning. The phrase is generally taken to mean that Franklin found static electricity capable of inducing changes in metal much like melting, but without producing the sensible heat that would normally have accompanied the process. As the foremost student of lightning of his day, there is a reasonable possibility he saw ball lightning or other plasmoid phenomena. We know that German physicist Georg Wilhelm Reichmann, attempting to replicate Franklin's famous kite experiment the following year, did. Briefly. "A glowing ball of charge traveled down the string, jumped to his forehead and killed him instantly - providing history with the first documented example of ball lightning in the process." (APS)

Observed ball lightnings tend to range from fist to furniture sized. This is probably more an observer selection effect than a physical one. We know that latter-day experiments by Bostick, Shoulders, Matsumoto, Adamenko, Jaitner, and others have produced condensed plasmoids with sizes (and characteristic tracks) range down to the 50 micron range, requiring microscopes to see their structure. 

Cold fusion, in Franklin's sense, definitely appears to be going on when a plasmoid touches down on to matter, be it metal or dielectric. Condensed plasmoids (hereinafter CPs) disrupt matter very much as super-highly charged ions do, by yanking electrons off atoms, removing bonds and causing the atoms to repel each other electrostatically. 

Here are two photos from Ken Shoulders' work showing holes made in lead glass and aluminum respectively by CPs.  


In these pictures, CPs have drilled through an aluminum coating and into a slab of alumina (Al2O3, a very hard ceramic and the primary constituent of ruby and sapphire), spewing alumina back out the holes in such a way as to form a patchy coating on the aluminum.

It's pretty clear that ionic disruption, not heat, is the causative agent here, so we have cold fusion in Franklin's sense. What about the more modern sense of nuclear reactions? Here is a micrograph of a similar hole in a deuterium-loaded palladium foil. Although most of the foil remained pure palladium, the gunk around the hole(s) evidenced significant amounts of silicon, calcium, and magnesium.


So what's going on? The theory is that CPs form when a spark, ranging from rubbing a cat and touching a doorknob to lightning, finds just the right conditions for a runaway ζ-pinch which magnetically squeezes the plasma to atomic scales. Considered in isolation, a current like that hanging in free space really wants to form a loop, since it's creating a major positive charge at one end and a negative one at the other, and the ends thus attract. When the ζ-pinch runs away it's capable of squeezing nuclei together close enough for tunneling to happen, and what happens then depends on what nuclei happen to have gotten trapped in there.

What happens then is problematical if only because there are so many possibilities depending on both the environment and the configuration of the CP. But it seems that in come cases, especially in metal, the CP can dig itself a "nest" which both stabilizes it and provides it with fusion fuel (e.g. deuterons with which a palladium electrode has been loaded, that seep out into the CP sustaining an ongoing reaction). Evidence for this is that electrodes that have exhibited cold fusion tend to be easier to start it up again than fresh ones, presumeably because the "nests" are already there and easier to form CPs in.

(Next post here)

Sunday, October 6, 2024

Condensed plasmoids

 The second post in a series; the first is here

So a plasmoid is a (more-or-less) stable configuration of plasma, currents, and magnetic fields; the most well-know example is ball lightning. Plasmoids require energy to form, and typically emit energy, by glowing or ionizing matter around them; when the remaining energy is too small to maintain the conditions of the stable cofiguration, the plasmoid typically explodes, releasing all the rest of its energy at once.

Giant multi-billion experimental fusion reactors use extremely high-temperature plasmas in configurations as much like plasmoids as possible, but they are not technically plasmoids, because they do not self-sustain and require the input of substantial energy (and externally supplied magnetic fields) to operate. There are currently about 45 companies trying to build fusion reactors, up from 10 a decade ago. Fusion in plasmas has been achieved many times: the trick everyone is trying for is to get more energy out than you put in.

A condensed plasmoid, on the other hand, is something closer to the size of your hand than the Eiffel Tower. Indeed the ones that we think we have seen generating more energy than they lose are microscopic or not much bigger. Sometimes, if this interpretation is correct, they remain stable for days, generating substantial energy with no external energy input. How can this be if it is so difficult to get a big tokamak to do the same thing?

We believe that the key is that the condensed plasmoids are cold. Heat (and the big reactors are intentionally trying for millions of degrees) increases pressure, and thus fights against the squeeze of the ζ-pinch effect. If a plasmoid is microscopic, it will lose heat fast through radiation. Of course normally it would then simply revert to normal matter, like a spark in a bug-zapper. But if the right combination of (very high) current, (fairly low) pressure, chemistry, and so forth happens, you can get a runaway ζ-pinch which magnetically squeezes the conducting path to atomic scales, which in turn raises the magnetic force squeezing it to astronomical levels.

The resulting plasmoid is called "condensed" by Jaitner and his group; I think the choice of the word is inspired. Previous descriptions either don't capture the real dynamics of the phenomenon ("EVs", "charge clusters") or anything significant at all ("exotic vacuum objects," "strange radiation"). Condensation in the formation process reasonably describes the reduction of the conducting path to atomic dimensions, and not incidentally forces nuclei that have been captured by the excess of negative charge into considerably closer proximity than they could be found even in normal, solid, "condensed," matter. This is not your grandfather's plasma.

... and if it should turn out that the core current in a condensed plasmoid is in fact superconducting, the word "condense" is already used in the theory of superconductivity to refer to the same phenomenon.

Epistemic status check: condensed plasmoids are undeniably a real thing. They have been observed by many experimenters and were studied extensively by Kenneth Shoulders in the 80s (he called them "EVs"). If you wish to study them yourself, extensive and detailed information can be found in US patent US5018180A. (But be careful -- the Russian researchers call them "strange radiation" for a reason.) The physical theory and interpretation here are new in detail but phenomena suggesting nuclear activity, including elemental transmutation, radiation (including hard X-rays), and inexplicably large energy generation, have been experimentally verified again and again.

The result is a state where the nuclei are cold, by processes reminiscent of laser cooling in optical tweezers, but at the same time forced together close enough for fusion to occur. What then?

Normally you would expect that from fusion (of anything to the left of iron-56 in the curve of binding energy) you would get energetic nucleus fragments (protons, neutrons, alpha particles, etc) and serious gamma rays out as a result. You can fire basketballs into a trash can with a catapult but don't expect them to make a nice soft landing and sit there. Here's where we get to the second part of my revelations at IWAHLM-16 -- the progress in the quantum mechanics of down-conversion by the MIT team. What that means is that there are recognized pathways for a giant dollop of energy not to explode a nucleus the way it normally would, but to parcel out its energy to a host of smaller recipients, like the electrons forming the current of the plasmoid.

After this, it's all details. The devil is in them, of course, but key elements of the physics may be coming into sight. The condensation of the plasmoid is in a runaway mode until the electrons can't be squeezed any further. At that point the plasmoid is negatively charged and nuclei are attracted into it, where they may be squeezed close enough together to fuse. The plasmoid, which if it isn't technically superconducting in the condensed state is doing something quantum mechanical enough to act like it, supports the down-conversion dynamics. So each, or at at least enough of, the nuclear fusions add energy to the plasmoid current, which keeps it going or can even produce more energy than went in.

Once we get a solid understanding of the physics, our new energy revolution will be about where the Industrial Revolution was in 1643 when Torricelli invented the barometer. Technological progress moves faster now, though, so we might live to see some useful results. Like megawatt generators you can carry in a pocket that use (tiny amounts of) air as fuel.

[Next post here.]

Thursday, October 3, 2024

Paradigm shift in cold fusion?

 Petrified with astonishment, Richard Seaton stared after the copper steam-bath upon which he had been electrolyzing his solution of “X,” the unknown metal. For as soon as he had removed the beaker the heavy bath had jumped endwise from under his hand as though it were alive. It had flown with terrific speed over the table, smashing apparatus and bottles of chemicals on its way, and was even now disappearing through the open window.

—E. E. “Doc” Smith, The Skylark of Space

Chapter 5 of "Flying Car" opens with this quotation from the iconic space opera. I then proceed to compare the rambunctious events in the novel to the almost-as-rambunctious events of the first few years of the cold fusion saga. There was enough of an amusing similarity to inspire the comparison -- in the novel, Seaton was an electrochemist doing electrolysis experiments with platinum-group metals, for example -- and to include the science fiction novel in the discussion of an extended episode of actual science.

But at this point it is worth our time to consider the differences. In real life, Fleischmann and Pons, after their original startling burn-through event and subsequent more careful experiments involving heat gain, continued doing exploratory experiments, with spotty results. Other experimenters got similarly spotty results, occasionally getting excess heat and sometimes, as with Mizuno in Japan, run the current for months and get nothing, then suddenly get 10 times as much heat out as you were putting in, and sometimes the reactor would produce power for days even after the input power was turned off. There were even, thankfully rare, explosions.

Mizuno's "Heat after Death" reactor

In the novel, by contrast, Our Hero does not continue experiments but instead sits down to work out the basic theory of the thing before fooling around with it. Meanwhile the bad guys try to steal the discovery, run off and do experiments without any theoretical understanding, and blow themselves up. 

Sorry, but that's the difference between a SF novel and reality. In real life, science proceeds by the slow, groping-in-the-dark methods of the experimenter. The first version of "Flying Car" came with an appendix listing all the experimenters who had died in the quest for flying machines. The names filled a page. It is only after the accumulation of knowledge from experiment that we know enough to form useful models. Even Newton, genius though he certainly was, needed both the painstaking observations of Tycho and regularities worked out by Kepler to make the breakthrough into a modern understanding of solar system dynamics.

People have been trying to understand cold fusion phenomena for 35 years and don't seem to have made an awful lot of progress. A lot of detail has been collected but nothing you could call a set of generally applicable organizing principles. It's not that there isn't a theory; it is that there are hundreds of theories and none of them has shown enough overall explanatory power to displace the others.

It's my experience that when you get into a situation like this, it's because you just have the wrong model of what's going on, and you aren't interpreting your evidence appropriately. God isn't sending lightning to strike your church because the congregation is sinning; Maxwell's equations are sending lightning to strike your church because it is the tallest pointed object in the area. All the squabbling over who's sinning the most is, to steal a phrase, not even wrong.

 Thomas Kuhn would have said that anomalies are accumulating and a paradigm shift is eminent. 

I recently attended IWAHLM-16 (a conference in memoriam of Bill Collis) in Strasbourg. The workshops are perhaps second to the main ICCF conference series. I hadn't expected much, but Strasbourg has 99 Michelin-rated restaurants and it fit into my schedule; I thought I would get to say Hi to some old friends. 

I was pleasantly surprised. There were two new things, one of which I had known about and one I had missed, even though if I had been paying close attention I might have picked up on. 

First, the one I knew about, is Peter Hagelstein's (an MIT physics prof) quantum mechanics-based theories of how a fusion (or other nuclear) reaction might spread its resulting energy out over a (very) large number of things, such as a lot of atoms' motions comprising heat, instead of spewing protons and neutrons and gamma rays around as happens when you achieve fusion in a particle accelerator. This work had advanced significantly, there is a whole group of grad students and researchers involved in it, and a "big paper" is expected soon. 

The other new thing wasn't really new, and indeed I had been seeing it for some time but filtering it out. Cold fusion tends to attract enough people with way-out theories, so much that you would waste way too much time if you tried to seriously consider all of them. So one develops mental filters to make a first cut and allow you to spend your time thinking about the things that have a greater chance of turning into useful and explanatory theories.

Among the things I had been filtering out were "strange radiation" and "exotic vacuum objects" or "EVOs". They might as well have been saying "UFOs" as far as I was concerned.  So before I proceed, lest you have the same reaction, let's state a few things that are well-known, incontrovertible, mainstream physics.

  • Plasma is the 4th state of matter, and indeed almost all the matter in the universe is plasma: stars. Lightning is also plasma. 
  • Fusion occurs in plasma; indeed most of the mainstream experimental fusion reactors use plasma.
  • The Z-pinch (sometimes ζ-pinch) effect is a phenomenon of bog-standard electromagnetic theory: although stationary like charges repel, moving charges (currents) in parallel produce magnetic fields that tend to attract. (Which force wins depends on details.) The ζ-pinch effect is used in virtually every plasma-based experimental fusion reactor.
And here are some things that are not so well-known, but which are well-supported by historical and experimental evidence:

  • A plasmoid is a (more-or-less) stable configuration of plasma, currents, and magnetic fields; the most well-know example is ball lightning.
  • Plasmoids can be created in the laboratory in sizes ranging from ball lightning down to microscopic. This has been done by multiple researchers over the 20th century, all of whom named them something different!
  • Microscopic plasmoids in contact with metal surfaces leave characteristic craters and other surface deformations.
  • Working, i.e. heat-producing, cold fusion experiments are typically found to have left similar stigmata on electrode surfaces.
  • In a series of successful cold fusion experiments at SPAWAR, IR videos of the electrodes showed that the process was characterized by the twinkling of thousands of points of heat on the electrode surface.

The hypothesis is that microscopic plasmoids form an environment that supports fusion. I had seen the talk by Gordon linked above, at ICCF-21, and a talk by Jaitner at ICCF-22 laying out the hypothesis, but hadn't made the connection. It wasn't until I ran into Jaitner again at IWAHLM-16, when he had moved from theory to experimental results, that I made the connection.

Will all this constitute a paradigm shift? I think it could. Condensed plasmoids could explain why fusion occurs and the MIT down-conversion quantum mechanics why it provides energy in a way that keeps the plasmoid going without external power. (Why "condensed"? Next post (here), or just watch the talk!)


Friday, February 25, 2022

Fusion, the Fuel of the Future

 Did it ever occur to you that you could run an ordinary car engine -- cylinders, pistons, crankshaft and all -- with no fuel? 

No problem! You just install really heavy-duty spark plugs, and as the piston reaches the top of the compression stroke in each cylinder, fire off a huge spark, think of it as a small bolt of lightning. The air doesn't care where the energy comes from, just that it gets hot and expands to push the piston back down. As long as you dump as much energy in through the spark as you would have gotten from oxidizing fuel, the motor hums right along. 

Of course, this would be a horribly inefficient way to use electricity to turn a shaft; existing electric motors are much much better. The point of the mental exercise is to get you to compare the amount of energy used by the spark and that produced by burning the fuel. Realize that they might actually be comparable.

In fact, that's what is going on in pretty much all current fusion experiments. So far, nobody has managed to get as much energy out of the fuel as they put in in the spark. The latest big buzz from the JET torus managed about 70%. However, with the current amount of interest and investment, it seems likely that someone will hit  100% (or exceed! 101%!) sometime this decade.

When you hear about that, what will it mean? 

Nice bit of science, not so much for energy. Let's go back to the car engine. 70% or so of the energy produced by the burning fuel is simply thrown away as heat. Then of the mechanical energy you get, you use a lot of it overcoming friction in the engine, turning a generator to produce more sparks, even pumping coolant through the engine so it doesn't melt. 

We don't really know in its fullness how the energy from the fusion reactor is going to be turned into (say) electric power, but we can say with fair assurance that it's not going to be cheap, easy, or efficient. So even when the magic 100% figure gets achieved (and for more extensive times than 5 seconds!), it's virtually certain that you have at least another decade to wait before there is any fusion power flowing on the grid.


Saturday, March 13, 2021

Foo Fighters

 Interesting post from Robin Hanson about how the universe may be full of incompetent aliens who may have randomly been sending UFOs to us for centuries but never got anything done. I agree with most of Robin's points about how our power structures are enormously wasteful, sort of like the ancient Chinese empires, and we shouldn't really expect our civilization, or the aliens, to do any better on the average.

He uses the "Foo Fighters" seen by WWII aviators as an example of something that may have been alien craft:

... pilots flying over Germany by night reported seeing fast-moving round glowing objects following their aircraft. The objects were variously described as fiery, and glowing red, white, or orange. Some pilots described them as resembling Christmas tree lights and reported that they seemed to toy with the aircraft, making wild turns before simply vanishing. Pilots and aircrew reported that the objects flew formation with their aircraft and behaved as if under intelligent control, but never displayed hostile behavior. However, they could not be outmaneuvered or shot down. 

The main problem with this as an alien spacecraft, though, is that I have seen one of these myself.

And I know what it is.

It was a couple of decades ago. We were on a cruise ship, sailing up the Canadian/Alaskan Inner Passage, about a night out of Skagway. We had splurged for the trip, so we had a top-deck cabin with a balcony (and a butler). Just about bedtime, on the night in question, I stepped out onto the balcony for a breath of fresh air before turning in.

It was slightly overcast and very still. I could see shore lights in the distance, and the ship made steady progress through a sea that was almost like glass. There was no moon.

I looked forward. There was a glowing disc hovering maybe 200 feet over the bow. It dashed out in front, almost like a dog running in front of a car. It came back. It danced around. It made circles around the ship. It stopped overhead, never quite standing still, but I got a good look at it. Featureless, round, glowing softly.

It was completely silent.

I watched it for maybe 10 or 15 minutes. Then it disappeared. I went back in, mentioned to my wife that I had just seen the most amazing thing, and went to bed.

What could it have been? The only thing I have seen even vaguely like it was the spot from a searchlight dancing on the bottom of a cloud layer. But the ship didn't have the right kind of searchlight, it couldn't have done the fine dancing, it would have changed shape as it tilted low to go far out, and the beam would have raked the deck as the spot dashed from stem to stern and I would have seen it. Nothing like that happened.

But it was a clue. Something like the searchlight had happened, but not from below. The overcast layer was thin, of a kind I have seen many times flying. We were in northern waters, and as it turned out, some people in Skagway had seen aurora that night.

We were on an enormous iron object, moving, and that does interesting things to the Earth's magnetic field. In particular, it can focus a tendril out of an otherwise diffuse electron flow, as seen here:


So the ship had gone through what would otherwise been a nearly invisible aurora borealis, and concentrated it into visibility as it pierced the thin cloud layer. If you've played with a plasma ball like this, you will be very familiar with the character of its motion and why it seemed to be interested in the ship.

And it sounds a lot like the descriptions of the "Foo Fighters."


Sunday, March 7, 2021

A Complex Treasure

 In the wake of this recent work, there has been a resumption of the sporadic debate over which imaginary numbers are real (pun intended) or not. Not so much by mathematicians, who tend to believe that they discover, rather than inventing, the structures of thought they employ, but physicists, who tend to think of the math they use as a different order of being than the actual physical world they describe.

From a pragmatic point of view it doesn't matter. If you have various mental tools, use the one that works best. The best meta-rule is Ockham's Razor.

In that spirit, I thought I would revisit a cute little puzzle that is often used to show how complex numbers are a bit more simple, nifty, or appropriate than just plain pairs of coordinates for solving a problem. The problem has nothing to do with the deeper properties of the quantum field; it's about a treasure map. 

It goes like this:

You have come into possession of a chart from a pirate long dead. It shows the location of a small island in the Spanish Main, and on the back are directions to find the treasure. "Pace from the cairn to the ash tree, turn right and pace the same, driving a stake. Again from the cairn to the bay tree, turning left and pacing the same, and a stake. Midway between your stakes is the treasure to be found."

You get to the island and find the ash and bay trees. Unfortunately in the meantime the island has been visited by a gang of kleptotaphophiles, who stole all the stones of the cairn, leaving it unmarked. How can you find the treasure?

Or, since this is really a math puzzle, how can you use complex numbers to prove your solution is correct?

The trick with a math problem is often to gain an intuition as to what the solution is, and then use the tools you have to show it is right. 

In my experience you are much more likely to be taught how to use the tools, and less likely to be taught how to gain an intuition. With that in mind, let's look at the map.

On our island it just so happens that the bay and ash trees are on an exact east-west line, and are exactly two furlongs apart. (A mathematician would phrase that, "Without loss of generality we may assume ..."). 

Now here's the essence of gaining an intuition. Take boundary cases, cases where something goes to 0 or 1, anything to simplify the problem without changing it overall. In the case of the treasure map, for example, start with cases where you can easily see the answer without doing any numerical geometry.

Let's call the point midway between the trees "Zero" and see what would happen if it were the cairn.

Pacing and staking, we get a simple diagram that shows the treasure would be exactly one furlong due south of Zero. Okay, what's another way to simplify?

Just pick the cairn as being one of the trees. Then the pacings for that tree are of zero length, and you drive the stake right there. When you pace the other tree you get:

Whaddya know, one furlong due south of Zero. And obviously it works the same starting from the ash tree.

What else can we eliminate? How about the string between the stakes? If they are in the same place, the centerpoint, and thus the treasure, will be right there. Put the cairn at one furlong due north of Zero:

Yep, it's at the same spot, one furlong south. And for a final flourish, what if we put the cairn right on the treasure?

Well, by now you will have gained the intuition that wherever you put the cairn, the treasure will be in the same place. And you even know where the place is. 

You now have your conjecture, and can prove it fairly straightforwardly using complex numbers.

But while you are doing that, I will have jumped to a conclusion, dug up the treasure, and escaped.


Saturday, March 6, 2021

Bayesian Death Match

 How likely are you to die of, say, covid versus, say, heart attack next year? If you look at official figures you are met with a variety of bewildering metrics. Furthermore it can be confusing to interpret what they mean in the first place. Here is a website that uses CDC figures to tell you what your odds are of dying of various causes, looking kind of like this:

Cause of Death Odds of Dying
Heart disease 1 in 6
Cancer 1 in 7
Suicide 1 in 88
Fall 1 in 106

Of course, this doesn't mean you have a 16% chance of dying of a heart attack next year; it means when all is said and done, given that you died, the chance it was by heart attack was 16%. This is beginning to sound pretty Bayesian, so let's see if we can turn it into something more intuitive.

Manipulating probabilities by Bayes' Rule is powerful but often less than straightforward. Luckily there is a way to do it that is quick and easy. The trick is to think in terms of the logarithm of the odds ratio. You are used to thinking of probabilities as a number between 0 and 1; just think of them this way instead:

  • -30 -- a billion to one against; your chance of winning a rigged lottery
  • -20 -- a million to one against; your chance of being struck by lightning in a year
  • -10 -- a thousand to one against;  your chance of flipping ten heads in a row
  • 0 -- even odds
  • 10 -- a thousand to one for; the chance you won't flip ten heads in a row 

and so forth. What we have done is taken the base-2 log of the odds ratio. Why would we do this?

The reason for using this log-odds form is that we can apply Bayes' Rule simply by adding them. Here's an example: the logodds for some given random average American to die (of any cause) next year is about -6 (roughly 1%). The logodds of dying in a car accident given that you died is -6.7. So the logodds of dying in a car crash next year is -12.7.

But we can do better than that. You aren't a random American: you can improve your estimate of the prior by knowing, for example, your age. CDC says:

This translates to 

Age Logodds
20 -10.5
30 -9.6
40 -9
50 -8
60 -6.8
70 -5.8
80 -4.5
90 -2.9

So rather than start with just -6, you'd start with the number associated with your age. Or you could have a table by sex, or whatever other division you thought made a difference.

Then add the number for the thing you're worried about. Dying from a fall is -6.7. So if you're 20, your total risk from falls is -17.2; you'll outlive Methuselah. But if you're 90, it's -9.6, well within the range of things to worry about.

The numbers for heart disease, cancer, and covid all stand pretty close to -2.6. Do the math.

Saturday, February 20, 2021

Energy Mess in Texas

 So we were having dinner with some friends last night and the topic of blackouts in Texas came up. It quickly became clear that people had not just an ideological slant to what they believed, but that it was so bad that you wouldn't believe they were talking about the same situation. One one side, it was because the windmills froze. On the other, the windmills didn't matter because they were only 14% of the total, it was because Texans were gun-toting cowboys who had to do things their own way and refused to listen to the real experts.

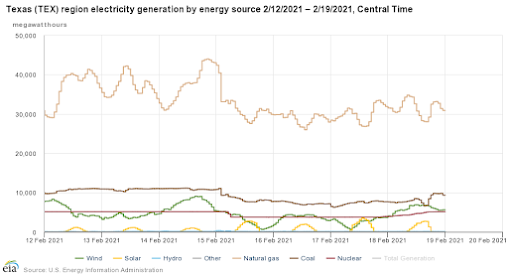
So let's go to the EIA (the federal Energy Information Agency) and see what actually happened with energy generation in Texas:

The tan line across the top is natural gas-fired generation. Brown is coal, red is nuclear, and the green line is wind.

First and most obvious point: on 15 Feb every significant form of generation took a hit. Gas dropped 10 GWh, coal and nuclear dropped a notch, and wind went from varying between 5 and 10 to varying between 0 and 5.

That's just how ice storms work: they freeze windmills; they freeze up the big piles of coal that are the reserves at those plants; they freeze up valves in gas pipelines and even safety sensors at nuclear plants. Furthermore, a huge unexpected cold snap diverts natural gas for heating, and there simply wasn't enough of it.

Unexpected? Indeed. Less than a month before, the forecast for Texas had been unseasonably hot:

This was from the Weather Channel, but they were using NOAA Climate Prediction Center numbers.

What actually happened? When push came to shove, Texas generating capacity got reduced by the storm and maxed out at well less than demand. They had no excess capacity to fall back on. The deep question here is why not?

This essay by a retired electric utility planning engineer sheds some light on the subject. Most of the country has utility markets where people pay both for energy delivered and capacity. You have to pay for capacity because it costs money to build the extra plants, the extra pipelines and storage facilities, and so forth. No money, no extra capacity to use in emergencies such as ice storms.

Most of the country has markets for energy actually used but also for capacity. It's like paying for seatbelts and airbags in your car. You hope not to have to use them, but...

But in Texas, there is no capacity market. It's pay for actual delivered energy only. The main reason is politics; the wind generation sector in Texas, most famously T. Boone Pickens but plenty more, has huge clout there. Texas generates more electricity from wind than any other state, even California, and indeed more than almost any country.

But, and this is the crucial fact, wind has no excess capacity. Look at the graph again: from 14 to 15 Feb. wind power dropped from 10 GWh to 0. Not only did half the windmills freeze, but the wind stopped blowing. A capacity market in Texas would have made wind significantly more expensive, and was thus politically untenable.

So Texas went with the delivered energy only market, specifically to help wind. Which worked. And when times are good, is cheaper, like a car with no airbags. But when the ice came, Texas had neither belt nor suspenders--and got caught with its pants down.


Thursday, February 4, 2021

Powerpaste, the fuel of the future

 Following in the theme of my ammonia posts, here's a new idea in hydrogen carriers as fuel for hydrogen fuel cells. It's from the Fraunhofer Institute, who call it powerpaste. It's basically magnesium hydride formulated in paste form. Add water and you get more hydrogen than you started with, the rest coming from the water. 


Unlike ammonia, the residue doesn't vanish as air and water; it's basically milk of magnesia, and would need to be recycled in a power plant. But it has (according to them) ten times the energy density of a battery, so it's a viable automotive power source. So to refuel, you swap out cartridges.

Given that they are pushing it for mopeds, I'm guessing that the full-cycle efficiency isn't high, but one imagines that could be improved over time.


Wednesday, February 3, 2021

Feynman could have saved your life

 We had Covid vaccines since March 2020, and yet we sat around all year, letting the pandemic develop into a major catastrophe, waiting for nothing but the permission of evil bureaucrats to use it.

Well, not quite. There is a huge difference between discovering the recipe for something in the lab and producing enough of it to protect billions of people. As we are seeing, nearly a year later the limited production of the vaccine is still a major bottleneck to public-scale inoculation. 

Some idiot on Twitter seemed to think that the problem was evil drug companies hoarding their recipes and this could all be solved by having everybody join in and produce vaccines. As often happens, the resulting Twitstorm provoked someone who knew something about it to speak up. In this case, it was Derek Lowe, pharma industry expert and blogger for Science magazine. Here is his post Myths of Vaccine Manufacturing.

To sum up the key point of the blog, Lowe lists 5 major step in producing a vaccine of the new mRNA type:

  1. Produce the appropriate stretch of DNA
  2. Produce mRNA from your DNA 
  3. Produce the lipids that you need for the formulation. 
  4. Take your mRNA and your lipids and combine these into lipid nanoparticles (LNPs). 
  5. Combine the LNPs with the other components and fill vials.
  6. Get vials into trays, packages, boxes, trucks, etc.
To make a long story short (do read the original and the mostly informative comments if you are interested), the major bottleneck is step 4. As Lowe puts it, "Everyone is almost certainly having to use some sort of specially-built microfluidics device to get this to happen .... Microfluidics (a hot area of research for some years now) involves liquid flow through very small channels, allowing for precise mixing and timing on a very small scale.... My own guess as to what such a Vaccine Machine involves is a large number of very small reaction chambers, running in parallel, that have equally small and very precisely controlled flows of the mRNA and the various lipid components heading into them. You will have to control the flow rates, the concentrations, the temperature, and who knows what else, and you can be sure that the channel sizes and the size and shape of the mixing chambers are critical as well. These will be special-purpose bespoke machines, and if you ask other drug companies if they have one sitting around, the answer will be “Of course not”. This is not anything close to a traditional drug manufacturing process."

So I went and looked at what these microfluidics machines for producing lipid nanoparticles (LNPs) looked like. What's the scale, how close to nanotech do you have to be, etc, etc.

from ACS Omega 2018, 3, 5, 5044–5051
So here's a sketch of the kind of thing we are talking about, and a scale of the nanoparticles themselves, which tend to range from 20 to 100 nanometers in size.

Here's a closer look at the actual gadget:

Although it produces ~50 nm LNPs, the gadget itself is micro-scale, not nanoscale, technology. They are generally made using photolithography on the same kind of machines as computer chips. This is a tricky and complex process, with a lot of planning, work, and development between even a well-specified design and a usable product.

So what if we had a technology that could produce things like this right off the shop floor? If the scale were millimeters instead of microns, you could make one of these in an hour in your garage with a slab of MDF and a router. I could print one tenth of that scale on my 3D printer, and there are printers out there that could beat that by another factor of 10.

If we had full-fledged nanotech now, none of this would matter; after all a LNP is just an arrangement of atoms. But what struck me when I read about this bottleneck was forcibly to be reminded of this passage in Where is my Flying Car, Chapter 14:

Is it Worth Starting Now?

Surely, you will say, it would have been wonderful if back in 1960 people had taken Feynman seriously and really tried the Feynman path: we’d have the full-fledged paraphernalia of real, live molecular machinery now, with everything ranging from countertop replicators to cell-repair machines.

After all, it’s been 55 years. The 10 factor-of-4 scale reductions to make up the factor-of-a-million scale reduction from a meter-scale system with centimeter parts to a micron-scale system with 10-nanometer parts, could have been done at a leisurely 5 years per step—plenty of time to improve tolerances, do experiments, invent new techniques.

But now it’s too late. We have major investment and experimentation and development in nanotech of the bottom-up form. We have Drexler’s PNAS paper telling us that the way to molecular manufacturing is by protein design. We have a wide variety of new techniques with scanning probes to read and modify surfaces at the atomic level. We have DNA origami producing arbitrary patterns and even some 3-D shapes. We even have protein engineering producing the beginnings of usable objects, such as frames and boxes.

Surely by the time a Feynman Path, started now, could get to molecular scale, the existing efforts, including the pathways described in the Roadmap for Productive Nanosystems, would have succeeded, leaving us with a relatively useless millimeter-sized system with 10-micron sized parts?

No—as the old serials would put it, a thousand times no.

To begin with, a millimeter-sized system with 10-micron sized parts is far from useless. Imagine current-day MEMS but with the catalog and capabilities of a full machine shop, bearings that worked, sliders, powerful motors, robot arms and hands. The medical applications alone would be staggering. ...

That's where we should have been, at the very least. But of course we would still have to wait for permission.


Saturday, January 30, 2021

The Batman Cometh (covid)

 In my previous covid post The Third Wave, I made the somewhat cavalier statement that instead of having a 1% chance of dying next year, with covid you had a 1.1% chance.

Now the third wave has fully developed into if anything a bit bigger than the first. Is that assessment worth revisiting?

I think it is, not so much because it was wrong (we'll see) but because it was too general. In particular, mortality from covid depends drastically upon age. Here are deaths by age group from the CDC:


The third wave has developed into an eerily appropriate Batman's second ear. There several things to note about this chart. The red line is 2020, the gray are previous years. But they are not death rates; they are death counts. Death rates climb much more steeply by age. Furthermore, the divisions are not comparable: look at the middle two. 45-64 is a 20-year cohort; 65-74 is only 10. So the apparent indicated rate in the latter should be twice the former.

Even so, it is clear (and quite true) that the effect of covid is bigger with advancing age. It rises from essentially nothing under 45 to about a 30% extra chance of dying (during any given period) at 90.

We can make this more apparent by taking actual actuarial figures and plotting the effect of the extra risk. 

The blue curve is the fraction of the population who (barely) reach a given age. The area under the curve is life expectancy at birth.

The orange is the same curve with covid, calculated with the excess death rates of late December.

That's important, so I'll repeat it. The orange curve assumes that the covid death rates continue all next year at the level of the peak of the third wave.

So what about that 1.1% instead of 1% chance of dying next year? As of now, roughly 0.1% of the US population has already died of covid. If it runs unchecked through the rest of the population, based on Diamond Princess numbers, it will claim another 0.2%. (That would amount to about 1.2 million deaths; we are already at 400,000.)

But critically, the risk isn't linear. If you're under 40, your risk of dying next year is less than 0.2% and covid does not appreciably increase it at all. If you are 70, your normal chance of dying next year would be 2.5%, and covid increases that to 2.9%. That is significant.

The bottom line here is that there simply isn't any one-size-fits-all response to the situation. 


Thursday, January 28, 2021

The Greenhouse Effect

 There is a vast amount of disinformation out there about the greenhouse effect. This is mostly because it's a highly politicized bit of science. If not, there wouldn't be much information about it of any kind, like rates of stress-induced creep in iron-terbium alloys.

But instead, as Mark Twain said, it's not what you don't know that gets you, it's what you know that ain't so. And there is a YUGE amount of stuff that ain't so about the greenhouse effect on the internet. This ranges from the "we're all gonna die" idiocy of the far left to the "there's no such thing as the greenhouse effect" of the far right. (It was one of the latter that goaded me into writing this post.)

So what is the greenhouse effect? It's a term used by astronomers to refer to some of the major phenomena of a planetary atmosphere. The easiest way to see it is to compare two planets, one with and one without an atmosphere. Luckily, we happen to have two such planets handy: the Earth and the Moon. As an added bonus, they are the same distance from the Sun and thus get the same amount of sunlight.


So here's Buzz Aldrin standing on the Moon. Behind him you see the shadow of the Lunar Module. The temperature of the ground in shadow is 160 degrees below zero Fahrenheit. The temperature of the ground he's standing on is plus 180. He's wearing those thick-soled shoes for a reason.


Here's the greenhouse effect in one picture. In red we see the temperature on the Moon over the course of a year. It varies, top to bottom, by roughly 300C or 540F. 

The blue line is the temperature where I live, measured every 20 minutes at the local airport. The day/night variation is more like 20 degrees. (There is also a seasonal variation that the Moon doesn't have, due to the Earth's axial tilt.)

The difference between them is the greenhouse effect. Without the greenhouse effect, we would freeze to cryogenic temperatures every night, and literally boil every day. Without the greenhouse effect, we could not live and would never have evolved.

What is the major effect of the greenhouse effect? You may have heard that it is to raise temperatures. Wrong. Look at the graph again. The major, obvious, effect is that the temperatures on the Moon vary 25 times more than the ones on Earth. The greenhouse effect compresses temperatures. As a secondary effect, it compresses them toward a level that is about two thirds up the Moon's scale.

How can that be? You will have heard that the greenhouse effect is like a blanket around you on a cold night. This is a misleading metaphor. You generate heat internally, so insulating you from a cold environment will warm you up. The Earth generates heat as well, but the amount of it is minor compared to the heat it gets from the Sun. So the appropriate metaphor is to put a blanket around you while you are standing next to a big hot fire. Perhaps you have done this in real life; I have. The blanket warms your back but cools your front. And that is what having an atmosphere does to a planet.

So what about the part where sunlight comes in one atmospheric window, but goes out another, and we're closing the outgoing one? 

Here's a chart of how this works. Scattering (which makes the sky blue) and ozone protect us from hard UV (another of the many things that would kill you on the Moon). Only about 3/4 of the Sun's light gets to the surface. Most is visible light but there is a substantial amount of infrared as well. You can feel warmth from the Sun on your face and other bare skin. There are plenty of places on Earth where the heat goes back out through the near-IR bands as well; you'd feel the heat from the sands of the Sahara or central Australia too!

Even so, the majority goes out through the 10-micron atmospheric window as well. The three curves there represent the patterns of energy as a function of wavelength for -82F (black), +8F (blue), and 98F (purple) respectively. All of the Earth is somewhere in this range, so most of the thermal radiation it produces will go out this "atmospheric window."

The atmospheric window is the gap in the absorption spectrum of water as seen on the top "major components" line. We can put it in perspective with the other energy flows through the atmosphere with this chart (with its two authors):


The atmospheric window is shown in red over near the right side of the graphic.

As we noted, the atmospheric window is a function of the moisture content of the air. Chances are you have personal experience of this too. There are moist cloudy nights where the temperature hardly drops at all. There are clear, cold, nights where there is hardly any water in the air.

The atmospheric window is smallest when it is moist:

(generated by HITRAN, the standard program/dataset for gaseous absorption. The horizontal scale is frequency measured in kaysers.)

And slightly less moist. The blue is of course absorption by water. The green you see on the left side is CO2.

And finally, very dry air as over the Sahara or the Arctic. It should be clear that the CO2 is more important when the atmospheric window is bigger, i.e. when there is less of the major, water based, greenhouse effect.

But we have been dumping CO2 into the atmosphere at unprecedented rates. What has that done to the window?

Here is the absorption spectrum of CO2 in the region of interest:

It's centered at about 670 kaysers, which is why it is hiding off to the left in the above pictures of the atmospheric window, which is centered at 1000. Here it again, but I have added the amount of extra absorption corresponding to the extra CO2 that has been added since 1900 (in red):


Wow, is that all? In a word, yes. The response to CO2 is logarithmic, meaning that absorption is proportional to the logarithm of the amount, and not to the amount itself. The reason is, as you can see, the band that CO2 absorbs is already mostly saturated. The amount of carbon in the air over a square foot of earth's surface is roughly equivalent to a square foot of black wool cloth. If it were carbon soot, the sky would be completely solid black. But it isn't; it's not carbon but carbon dioxide, which is transparent at most frequencies except this one. 
Only at the frequencies near the edges, where CO2 is translucent, does adding any more of it make much difference.

So here is the atmospheric window, this time with the CO2 we've added in the past century:
Humid air:
Moist:
Fair:
Arid:

So, the bottom line for CO2 is that it only makes much of a difference when the atmospheric window is already at its biggest, and the actual greenhouse effect is almost entirely due to water. And given that three quarters of the Earth is ocean, there's not much we could do about that. 
Even if we wanted to.
We would expect the effect of CO2 to appear primarily where there is not much water in the air. In other words, deserts and places where the water freezes out. Have a look:

As a bottom line, let repeat: the greenhouse effect is very real. It is absolutely desperately important for any life on earth: without it, the very air would freeze every night. It is 99.9% natural. It's been here since the earth had an atmosphere and liquid water. 
And that's a wrap!


Friday, January 22, 2021

The Henry Adams Curve: a closer look

From Where is my Flying Car, chapter 3: 

 Running on Empty

We could have predicted over the last few years what the American government's policies on oil and natural gas would be if we had assumed that the aim of the American government was to increase the power and income of the OPEC countries and to reduce the standard of living in the United States. 

—(Economics Nobel laureate) Ronald Coase (1981)

Henry Adams, scion of the house of the two eponymous Presidents, wrote in his autobiography about a century ago:

The coal-output of the world, speaking roughly, doubled every ten years between 1840 and 1900, in the form of utilized power, for the ton of coal yielded three or four times as much power in 1900 as in 1840. Rapid as this rate of acceleration in volume seems, it may be tested in a thousand ways without greatly reducing it. Perhaps the ocean steamer is nearest unity and easiest to measure, for any one might hire, in 1905, for a small sum of money, the use of 30,000 steam-horse-power to cross the ocean, and by halving this figure every ten years, he got back to 234 horse-power for 1835, which was accuracy enough for his purposes. 

In other words, we have had a very long-term trend in history going back at least to the Newcomen and Savery engines of 300 years ago, a steady trend of about 7% per year growth in usable energy available to our civilization. Let us call it the “Henry Adams Curve.” The optimism and constant improvement of life in the 19th and first half of the 20th centuries can quite readily be seen as predicated on it. To a first approximation, it can be factored into a 3% population growth rate, a 2% energy efficiency growth rate, and a 2% growth in actual energy consumed per capita. 

Here is the Henry Adams Curve, the centuries-long historical trend, as the smooth red line. Since the scale is power per capita, this is only the 2% component. The blue curve is actual energy use in the US, which up to the 70s matched the trend quite well. But then energy consumption flatlined.


This is the text where I introduce and illustrate what I call the Henry Adams Curve. But as it is one of the key points in the book, it bears some further looking into. The history of American energy use is interesting and complex, and has gone through several major phases. The graph above, and all the others you'll see in this post, came from the data behind this graph at the EIA:


The first point of interest is the deep history of energy in the 1700s. For nearly a century on the graph, the main energy source is listed as wood. In fact all the energy that did useful work was from food, and almost all the lighting was from tallow wax, neither of which is listed. Wood was used for heating, but as you will learn if you ever visit Monticello, when Thomas Jefferson would wake up on a winter's day, he would have to break the ice on his bedside washbasin to wash his face. (King Henry II did the same, as seen in the classic film Lion in Winter; that's just the way things worked.)

And yet the EIA lists a LOT of wood being used in the early days. This is more clear when you divide their numbers (in quadrillion BTUs) by population and convert to kilowatts per capita:

Brown is wood, black coal
If we take this at face value, for the latter half of the 19th century, that Adams was writing about, coal simply swapped for wood, and before that there had long been 3kW of wood per person.

But if that was the case, what on Earth was Henry talking about? Well, for example, in 1800 you went to England on a wooden sailboat, and in 1900 you went on a coal-powered steamship. Big difference. Doesn't show up in the raw energy numbers.
The bottom line is that using wood as fungible with energy is very problematic. In early days, the vast majority of woodcutting was not for firewood; it was to clear land for farming. (And those farms provided the real fuel, i.e. food.) Wood didn't save work; it cost a lot of work. If I clear land with a controlled burn, that wood simply doesn't count as energy fuel. 
So we need to think of the Henry Adams Curve primarily in terms of coal and subsequent fossil fuels. They were useful; they let us do things we couldn't before; they powered the Industrial Revolution. Henry Adams lived through the flourishing of the Industrial Revolution in America, and that is what he was talking about.

So here's the curve again, just fossils this time. We can zoom in on the Victorian period that Henry was talking about and it has a remarkable fit to an exponential growth curve (and remember we are talking per capita):
Wow. --and guess what: this isn't a 2% growth rate, it's a 4.2% growth rate. This curve was almost entirely coal-driven. The inflection point where it begins to flatline is exactly 1911: World War I. 
For most of the rest of the 20th century coal stayed more or less flat, but another curve based on oil, gas, and nuclear succeeded it:

Again, quite a good fit for those years; the big dip is of course the Great Depression.
The growth rate of the second curve isn't 2% either: it's 5.7%.
(Above a 0 level of 5kW)

You can see that the 2% curve (green) I used as the Henry Adams Curve in the book is a trend averaged from both of these.

If we had stayed on even the second curve, we wouldn't be using just 2.5 times as much energy, we'd be using 5 times. And as I argue in the book, that should have been quite technologically feasible.

If only we had wanted to.


Sunday, January 17, 2021

How to build a flying car IV: optimal control

 Let's have a look at the landscape of P-D controllers again:

You will remember it plots the standard deviation of the error, i.e. the difference of where the car was from where we wanted it, above a plane defined by just how hard we push given an error (left side axis) and the slope of the line above which we measure the error (right side). (Note that these numbers are just the coefficients of P and D in the standard formulation of a P-D controller.)

The valley indicating the best results appears to favor higher proportionality and lower, but non-zero, slope. But you can't increase proportionality forever; that would imply infinite force, and your motor is only capable of so much. Which should lead you to guess that we are going to have to look at bang-bang control again.

Here's the phase space again, with a controller that is stuck trying to go up as hard as it can. If, for example, you are sitting perfectly at the origin, position and velocity both zero, you would accelerate upward ad infinitum, to ever-higher altitudes and speeds.

That's represented by the red line in the upper right. But the line we are interested in is the blue one. It represents what happens when you are above the desired point, but decelerate as hard as you can. If you happen to be on the blue line, you will come in to the perfect one-point landing, hitting both zero altitude and zero speed exactly with no spiraling in.

Let's look at that quadrant more closely, pretending we are controlling a lunar lander on its way down to the moon:

Again, if you are on the blue line, perfect landing. If you are below it, you are too low and/or too fast, and you are S.O.L. -- you are going to hit no matter what. On the other hand, if you are above the blue line, you aren't going to hit at all. Remember the engine is on full pushing you up; you're just doing a takeoff from midair.

That's not what you wanted; you want to land. So what do you do?

You're hanging in space over the moon, and you need to get down. So you blast down as hard as you can until you are on the blue line, and then decelerate as hard as you can for a perfect landing. It should be fairly obvious with a little thought that this is the fastest way to get to the zero-zero point.

That is the essence of optimal control. It actually works from anywhere in the phase space, is the fastest possible way to get to zero, and gets you there in just two strokes, with no spiraling in.

In the parlance, the blue line is called the "switching curve."

That is, if your thrust and timing are perfectly exact, and there is no wind. Even with wind, it works quite well, although you hunt around the setpoint a bit:

The reason for the hunting or dithering is subtle. The switching curve is two halves of a parabola, and the closer you get to the origin the closer that gets to a straight line:

... and what's more, the closer the straight line is to absolutely flat! That means that within some small distance from the origin, we lose derivative control and the system orbits, like this:
We can get it back by having a hybrid controller that is mostly bang-bang optimal, but in a small band next to the switching curve, is P-D. We expand the switching curve like this:

placing the proportional region above it on the left, below on the right, and crossing in the middle, preserving an angle where the curve goes flat. The control signal as a function of the phase plane now looks like this:

This works quite well. In a run with no wind,

it does just about what we want from the optimal control in most of the space, with a very fast spiral at the end:


It does quite well with wind, too; in this graph orange is wind, green is the control signal, and blue the result. 

You can see that big sustained gusts push the system into bang-bang mode, but the rest of the time it maintains a nice (and smooth) hold on position with a proportional response. 

In phase space the result is a tight locus most of the time, with the excursions caused by major gusts exhibiting the characteristic clamshell orbits of optimal control.

There is one other phenomenon we need to look at, and that is lag. We noted way back that lag was the major problem for a controller, introducing derivative control to counter it. How well does our hybrid controller stand up to lag?

Here's a map of performance of a hybrid controller on a landscape with the width of the switching-curve band going up to the left and the amount of lag going up to the right. You can see that the controller gets better as it gets closer to the pure optimal controller, i.e. with a thinner band, except that lag just completely kills it. 

Luckily it's a fairly simple relationship, and if you know what to look for, it's not hard to design a good controller for the particular parameters of your system.

There's a lot more to control theory; I've barely scratched the surface here. Hopefully I have given you enough intuition to get a leg up on simple control system design problems.